
Ankylosing Spondylitis is an auto-immune disease which causes inflammation and eventual seizing up (ankylosis) of the joints of the spine, and to a lesser extent of the hips and shoulders. To determine the effects of treatment on this disease, patients were randomly allocated to either a treatment group, in which they received physiotherapy involving daily stretching exercises for their hip joints, or to a control group in which no stretching or other physiotherapy was provided. Hip mobility in terms of flexion (bringing the knee up towards the chest) and rotation (rotating the knee inwards and outwards) were measured on each side (right and left), before the study commenced, and after it was completed.
In this blog post, I will utilize linear regression models to ascertain the impact of treatment on hip mobility. The data from the study is avaiable as a base dataset readily available in the R environment called “hips”. All of the code for this analysis can be found on my Github.
Exploratory Data Analysis
To begin any analysis, exploratory data analysis must be conducted. I will only share a few of the more important findings from my EDA process.
Boxplots were created to analyze the differences in mobility before and after treatment (or no treatment for the control group) :
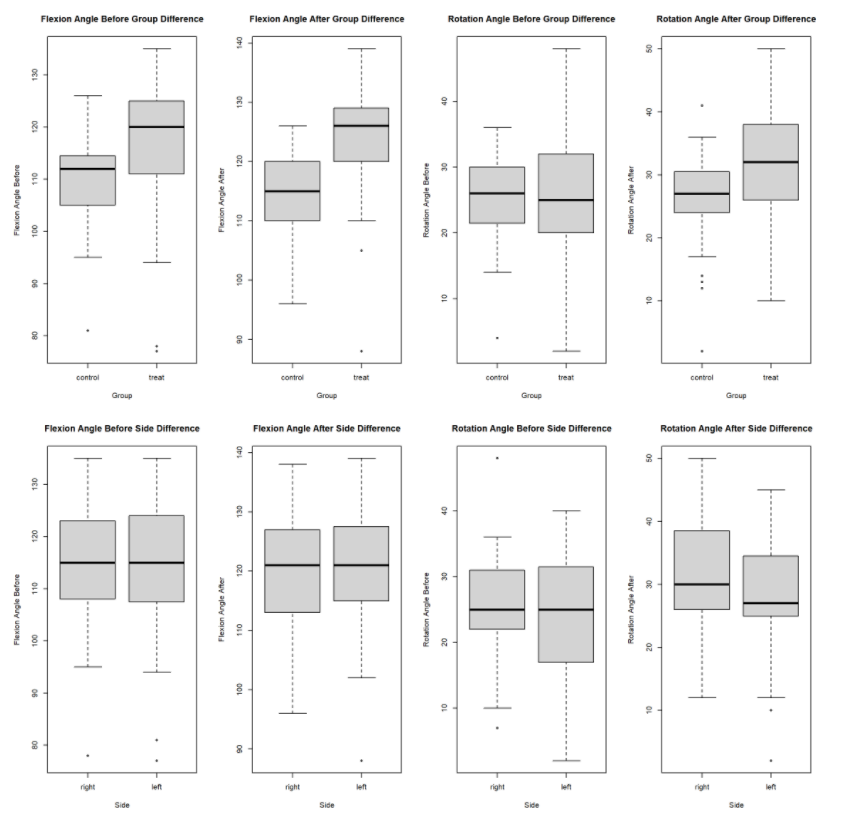
From the boxplot output, I observe that there there is minimal differences for the four predictor variables between the left and right side. The raftvariable has a slightly higher median for the right side versus the left. The rbef variable has a large IQR range for the left side versus the right. However, the fbef, faft, and raft variables all have a higher median for the treatment group versus the control group. The rbef median for the control group is slightly higher than the treatment group, but the treatment group has a larger IQR range.
Correlations between the mobility variables were computed as well :
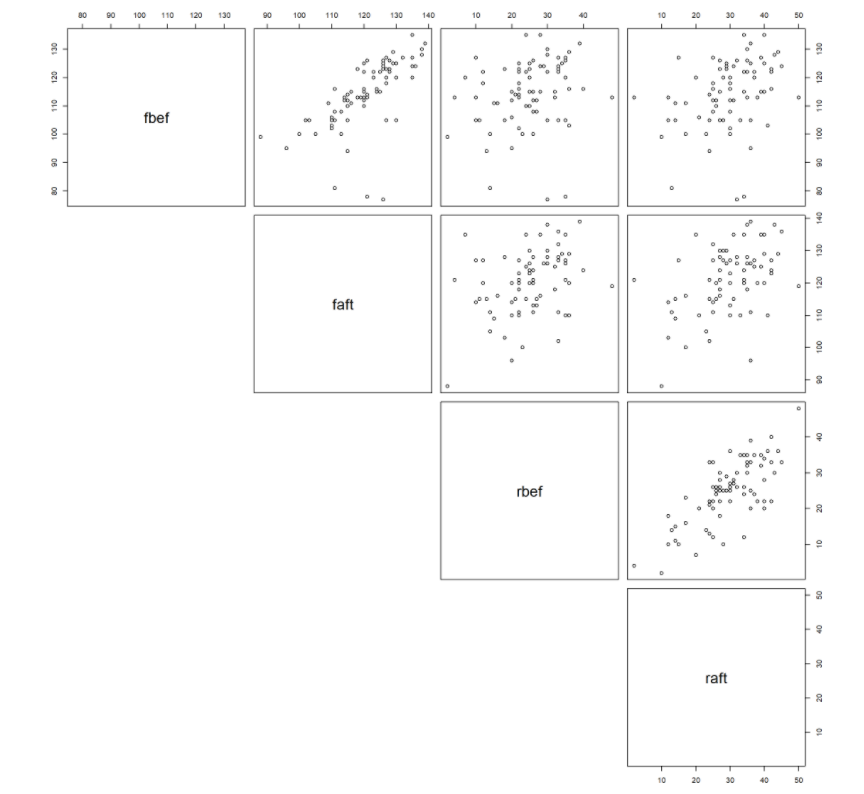
Positive correlations are seen between the before and after variables as the flexion and rotation angles before would correlate with the after values for the majority of patients.
Finally, I also created two new variables to calculate the difference between before and after mobility measurements. The histograms below summarize the distributions for both sides and treatment groups :
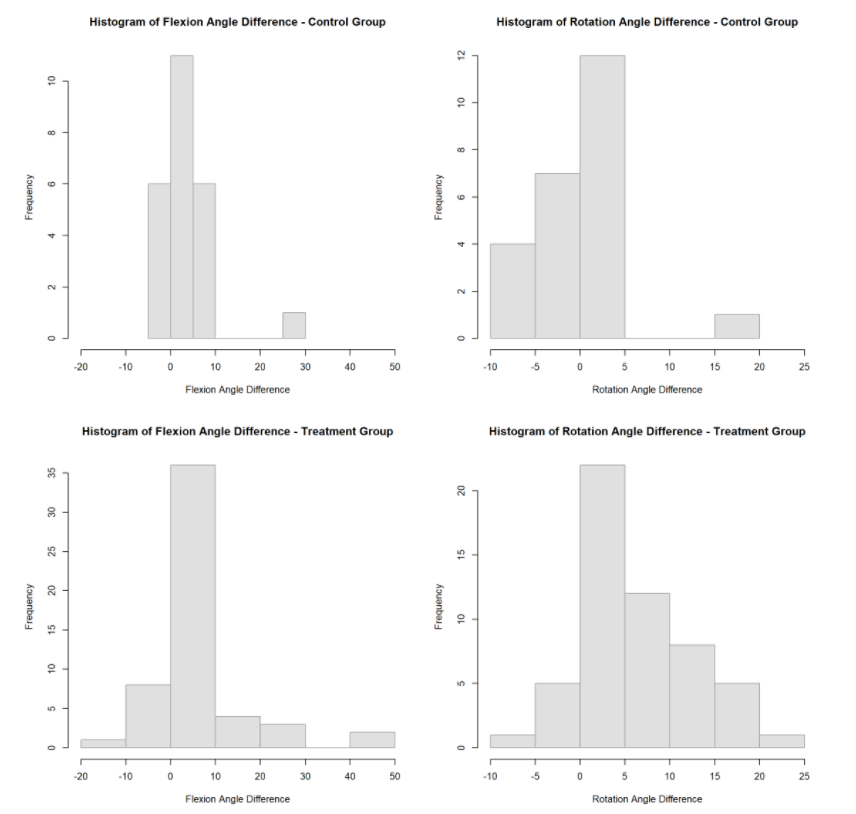
I observe that the treatment groups for both the Flexion and Rotation angle differences have a higher frequency of larger changes than the control groups. The Rotation angle shows a marked improvement for the treatment group especially. Both the control and treatment groups have the highest frequency between 0 and 5, but the treatment group has a higher frequency for differences above 5, and a lower frequency for negative differences. The Flexion angle has the higher frequency between 0 and 10 for both the treatment and control groups. However, the treatment group has a higher frequency of differences above 10, and also has more extreme differences for both positive and negative differences. This shows a possible treatment effect, but more exploration is needed to confirm what the graphs are showing.
Fitting a Linear Model
To study the possible treatment effect, I will create two linear models for both the flexion and rotation angle differences for one hip side. The linear model summaries can be seen below, using the right hips of the patients.
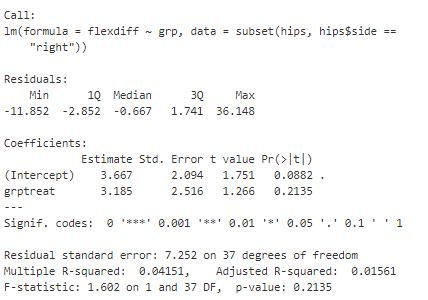
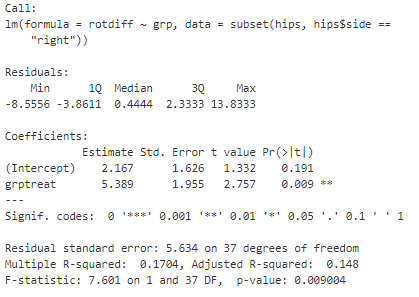
From the first output, I can conclude that there does not appear to be a treatment effect for the flexion angle difference. This is due to the grp variable not being significant at any level. However, from the second output, I observe that there does appear to be a treatment effect for the rotation angle difference. The grp variable is significant at the 99% significance level for the right side hips.
Also, since the linear models are simply a linear equation, I can also use the estimated coeffiecient to approximate the impact the treatment had. From the second output, I see that the estimated coefficient of 5.4 means that patients in the treatment group experienced an improvment of 5.4 degrees in the rotation angle difference on average.
Conclusion
This is a really simple application of using linear models for health data. I am able to quickly observe the treatment effect on one mobility outcome and approximate the numerical effect on the outcome. In further blog posts, I hope to expand on the application of linear regression to healthcare data.