
As everyone knows, COVID-19 has thrown a wrench in our everyday lives and the economic market. However, with downside of the stock market, there is an opporunity for investors to buy stocks at a discounted price. In this blog post, I will take a look at some quick analysis I conducted in Python to identify possible invesment opportunities.
Using Stock Data
This being my first time using Python to analyze stock data, I spent a huge chunk of my time figuring out the best way to do so. Luckily for you, I have summarized my method using the yFinance package. You can find detailed infomration and summary at the link. For this post, I will just share a handy little function I wrote to make downloading lists of stock data fast and easy. The function below can take in a single ticker or list of tickers, the start and end date, and returns the closing price for each ticker by day:
def get_stock_data(stock,start_date,end_date):

    data = yf.download(stock, start=start_date, end=end_date,threads=True)
    closing_data = data['Close']
    return closing_data
With this function defined, downloading historical stock data into a Pandas dataframe is easy:
stock = pandas.dataframe(get_stock_data(ticker_list),"2019-01-01","2020-05-19"))
In my case, I performed some research to manually build a list of “blue chip” companies. I am seeking to find companies with a strong reputation that I can hopefully buy into while shares are at a discount.
Analysis
With a dataframe of historical daily stock prices ready, the fun part begins.
My process and logic is outlined below :
- Calculate baseline and post COVID average stock price values
- Find companies with the largest decrease of stock price due to COVID impact.
- Of these companies, find the companies where the stock prices have not rebounded yet.
- From this list, perform due diligence and decide whether an investment is a good idea.
I will share some of my code snippets below to illustrate how I can use Pandas to easily calculate the information above.
To calculate the baseline and post COVID average stock price :
baseline_avg = stock.loc['2019-01-01':'2020-01-31'].mean(axis=0)
covid_avg = stock.loc['2020-05-01':'2020-05-19'].mean(axis=0)
To find companies with the largest decrease :
average_diff = baseline_avg - covid_avg
decr_stock = average_diff[average_diff>0].sort_values(ascending=False)
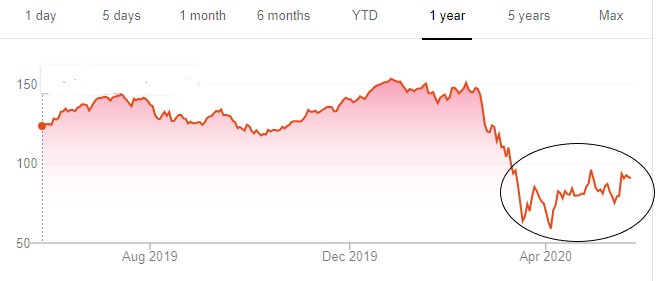
The image below shows what I mean when I say companies where the stock prices have not rebounded yet :
To do this, I decided to write a function that takes in the last n stock prices and calculates the slope of the best fit line through these data points. The function is below :
def trenddetector(n,array,order=1):
    data = array.tail(n)
    list_of_index = list(range(0,n,1))
    result = np.polyfit(list_of_index, list(data), order)
    slope = result[-2]
    return float(slope)
With the slopes calculated, I can then check which of the companies have a negative slope for the stock price over the defined previous number of days (in my case, 14 days) :
#Define which tickers to perform trend detection function on
stock_temp = stock[decr_stock.index.values]
#Apply the trend detection function to these tickers
trend = stock_temp.apply(lambda x : trenddetector(14,x),axis=0)
#Final list of tickers that had a decrease in stock price and negative trend over the last n days
final_stock_list = stock_temp[trend<0]
Finally, I wrote one more function that prints the company information by accessing the ticker object in yFinance :
def print_stock_info (array):
    stk_list = list(array.index.values)

    for i in range(0,len(stk_list)-1):
        stock = stk_list[i]
        tick = yf.Ticker(stock)
        if 'shortName' in tick.info:
            print(tick.info['shortName'])
        if 'sector' in tick.info:
            print(tick.info['sector'])
    return
print_stock_info(final_stock_list)
At this point, I have a list of companies that meet my criteria. Please understand that I performed my due diligence after this point to make my decisison of which stocks to buy.
Conclusion
The yFinance Python package makes it incredibly easy to download and analyze historical stock market data. While my process my fairly straightforward, Pandas made it easy to quickly calculate the values I needed to compare. This is my first foray into stock market analysis, but I will definitely be returning with some more content at some point in the future. Please take a look at my Github for all the scripts related to this project.